Reports
On Reports, generate, view, and manage different reports to obtain the required information. You can access the needed report from the left menu of the Analytics tab.
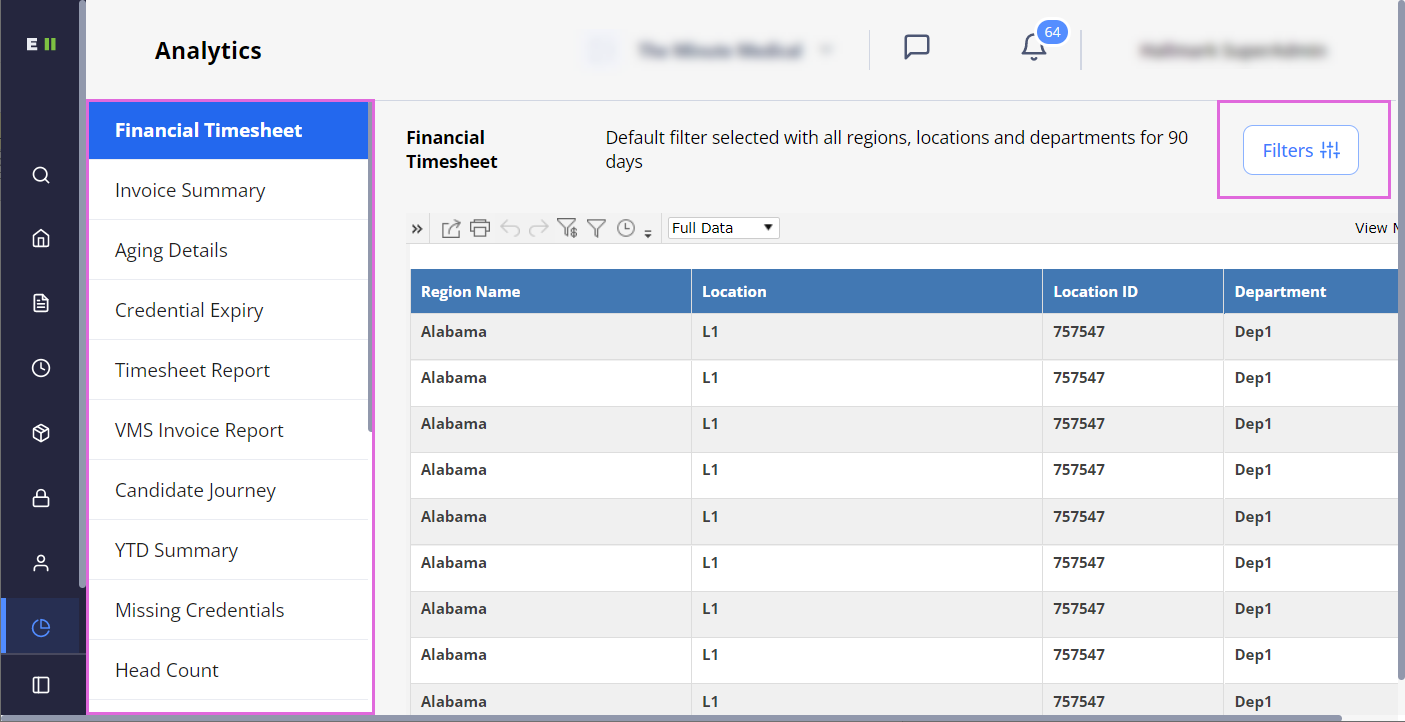
To pull the needed data for your report, use the Filter option in the upper right of the page and make the required selections.
Hide the imageSee the image.
- For most of the reports, a specific default filtering is used and indicated on top of the page.
Following are all the reports that can be available for your type of user:
- The reports you may access depend on your permissions.
- Financial Timesheet: shows details about Candidate(s)’ timesheets as per each of their Filled or Closed positions for the specified date range based on the applied filtering. This report will only reflect timesheet information, no manual invoice detail is included.
- Invoice Summary: shows invoice details of the Candidates within your Agency for the specified date range based on the applied filtering. The report includes all types of invoice records: expenses, manual invoices, and timesheets.
- Position Bill Rate Report: Shows all the bill rates for a candidate's position based on the applied filters. It includes only positions with the statuses Accepted, Onboard, Cancelled, and Offboarded.
- Missing Credentials: shows missing credentials only for Candidates in the Accepted and Onboard statuses. It includes required credentials with a toggle to include or exclude optional credentials in the report.
- Credential Expiry shows:
- All credentials that are expired or will expire during a Candidate’s position based on the applied filtering.
- Expiring or expired credentials that have an updated/renewed credential that does not have a gap in dates between the expiring credential and the new one. If there is a gap in days, then the credential will be included in this report.
- The filter for the report is based on the actual dates of the position.
- Candidate Eligibility: shows why a specific Candidate is not eligible for application to a particular order (does not appear in the Candidates List for that order). This report considers Open, In Progress, Filled, and Closed orders. It provides the order's and Candidate's details for your reference, including the skill match, credentials match, missing /expired credentials, and other information.
- Timesheet Report: shows timesheet details from the associated Organization(s) as per the timesheet service start and end dates based on the applied filtering. To view the Timesheet Summary, select this option from the Go to dropdown menu on the right of the page. Hide the imageSee the image.

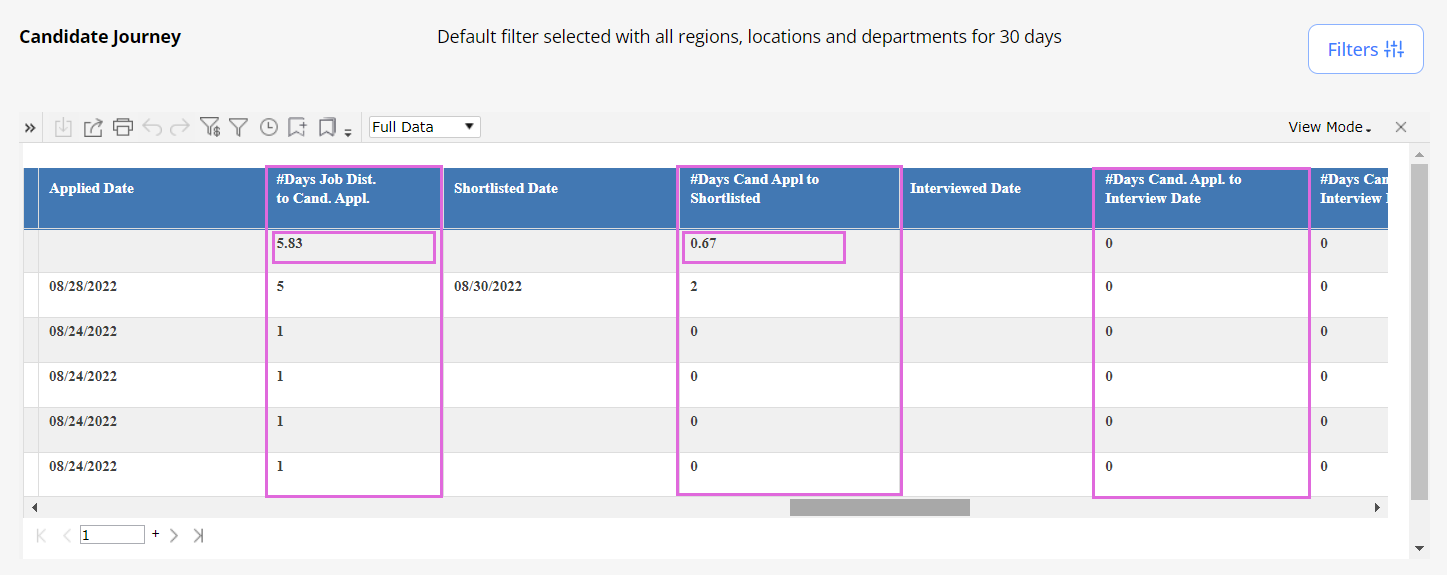
- Candidate Journey: shows details about Candidate(s)’ journey on a specific order, such as:
- How quickly a Candidate is applied to an order after its distribution.
- How quickly a corresponding Organization completes each step of a Candidate’s hiring journey from application submission to different statuses (for example, from the Candidate application to offering a position.)
- For the columns displaying the number of days between the different Candidate statuses, the first row in the table provides the average number of days for all Candidates, while all the following rows provide this number for each specific Candidate. Hide the imageSee the image.
- General Comments: shows only external comments left by your Agency users and the associated Organization(s) users on order, Candidate, and timesheet levels, based on the applied filtering.
- Performance Vendor Scorecard: shows performance details of the associated Agencies based on the applied filtering.
- The report considers all types of LTA orders, Contract To Perm orders, and Re-orders.
Select the Start Date, End Date, and Agency, then click Submit to filter the report . Select the Export to Excel icon to download the report as an Excel file.
This report shows analytics around the following areas with a detailed description below:
- Performance Metrics is calculated as the sum of 40% of TOA (Travellers on Assignment) %, 20% of the Total number of orders filled in 14 days or less %, 20% of the Starts Within 14 Days of Acceptance %, and 20% of the On Time Starts %.
Agency Travellers on Assignment Count all (Onboard, Onboard to Cancelled, Onboard to Offboard) positions in the agency whose actual start date falls on or within the selected date range for that agency.
Total Travellers on Assignment Count all (Onboard, Onboard to Cancelled, Onboard to Offboard) positions in the organization whose actual start date falls on or within the selected date range for that agency.
TOA (Travellers on Assignment) % Shows the percentage of Agency Travellers on Assignment among Total Travellers on Assignment.
Accepted within 14 Days
Within or on the selected date range, count all (Accepted, Accepted to Rejected) positions where the accepted date falls within 14 days of the agency’s distribution date.
Total Accepted Count all (Accepted, Accepted to Rejected) positions within or on the selected date range.
Total number of orders filled in 14 days or less % Shows the percentage of position Accepted within 14 days among Total Accepted position.
Starts within 14 Days of Acceptance Within or on the selected date range, count all positions with the candidate statuses of Onboard, Cancelled, and Offboard, whose actual start date falls within 14 days of the accepted date.
Total Starts Count all positions with the candidate statuses of Onboard, Cancelled, and Offboard, whose actual start date falls within the selected date range.
Starts Within 14 Days of Acceptance % Shows the percentage of position starts within 14 days of Acceptance among Total Starts.
On Time Starts Within the selected date range, count all positions with candidate statuses of Onboard, Cancelled, and Offboard, whose actual start date is less than or equal to the offered start date.
Total Starts Count all positions with candidate statuses of Onboard, Cancelled, and Offboard, whose actual start date falls within the selected date range.
On Time Starts % Shows the percentage of On Time Starts position among Total Starts position.
- Quality Metrics is calculated as the sum of 50% of the Submission Quality % and 50% of the Contract Completion %.
Qualified Candidates Count the rejected candidates based on specific reason codes and the candidates with statuses of Applied, Shortlisted, Custom, Offered, Accepted, Onboarded, Offboarded, or Cancelled, who applied within or on the selected date range.
Total Candidates Count all rejected candidates and candidates with statuses of Applied, Shortlisted, Custom, Offered, Accepted, Onboarded, Offboarded, or Cancelled, who applied within or on the selected date range.
Submission Quality % Show the percentage of Qualified Candidates among the Total Candidates.
Contract Completion Count all positions with statuses of Onboarded or Offboarded, where the actual end date falls within or is equal to the selected date range.
Total Completed Assignments Count all positions with statuses of Onboarded, Offboarded, or Cancelled, where the actual end date falls within or is equal to the selected date range.
Contract Completion % Shows the percentage of Contract Completion among the Total Completed Assignments.
- Overall Performance is calculated as the average of Performance Metrics and Quality Metrics.
Time to Submit Average number of days taken for the positions from the distribution date to the applied date, considering all positions distributed to the agency with candidates having Applied or higher statuses (including Rejected and Withdrawn) within the selected date range.
Time to Offer Average number of days taken for the positions from the applied date to the offered date, considering all positions offered to the agency with candidates having Offered or higher statuses (including those rejected after the Offered status) within the selected date range.
Time to Accept Average number of days taken for the positions from the offered date to the accepted date, considering all positions accepted by the agency with candidates having Accepted or higher statuses (including those rejected after the Accepted status) within the selected date range.
Time to Start Average number of days taken for the positions from the accepted date to the actual start date (including Cancelled), considering all positions with an actual start date that falls within or on the selected date range and candidates having Accepted or higher statuses (including Cancelled and Offboarded).
Manage reports
Use the options on the report toolbar to manage your reports. Hide the imageSee the image.
- The content in this section references the following source: insightsoftware 2022, Logi Report Server Guide v19.1, < https://pre-bi.einstein2.com/vt/help/userguide/server/content/launch-server-overview.htm >.
Export/print a report
To export a report:
- On the report toolbar, select the export icon
 to open the Export dialog.
 - In the File Name field, enter the file name.
- Specify the destination you want to export the report:
- View Report Result: select to directly open the report in the web browser if the format is supported by a plug-in of the web browser (otherwise, the Server prompts you to save the output file).
- Save to File System: select to save a report to a specified local folder.
- Save to Version System: Select if you want to save the report as a result version in Logi Report Server's versioning system.
- From the Select Format dropdown list, select the format in which you want to export the report.
- To specify the additional settings of the selected format, select More Options.
- Select OK to apply the changes and export the report.
To print a report:
- On the report toolbar, select the print icon
 to open the Print dialog.
 - From the Printer dropdown list, select the printer you want to use.
- To specify the printing properties, select the Properties… link.
- You can select the More Settings link to set more page properties such as paper size and margins, and others.
- Specify the number of copies, page orientation, and paper type for the printed report file.
- Select OK to print the report.
Schedule a report task
To schedule a report task:
- On the report toolbar, select the quick schedule icon
 to open the Quick Schedule dialog.
 - In the Schedule Name field, enter the name for the task.
- From the Time Type dropdown list, specify when you want to perform the task:
- To perform the task as soon as you submit it, select Immediately.
- If you want to run the task repeatedly, select Periodically, then specify to run it daily, weekly, or monthly at a specific time of the day.
- From the Publish To dropdown list, select where you want to publish the report and then specify the settings of the selected publish type.
- Select OK to submit the task.